It’s the weekend and I just had the luxury to watch a movie, The Grinch. It is about a little Whos from Whosville, who did not like Christmas and set out to sabotage the Christmas season. Likewise, I thought this title would be similar given the warning post sent out on Friday, before market hours, about the high potential bearish day where critical supports would be broken and a lower low close would be recorded for the week. Had anyone read it before the market open, they would have known that Friday was a given Bear day… and it ended the week on a bearish note as well. Bearing in mind (pun not intended), that the Santa rally should be about starting, this past week is almost like the Grinch where a wet blanket was just put over the jolly flames. Let’s look at the weekly charts review for a longer term technical picture and see what clues are presented…
The weekly S&P500 chart closed at a lower low, breaking down of a large range, after failing the 55EMA twice. This is the third visit to the target price level set earlier in October, but this time, price closed at this level instead of bouncing off. The recovering MACD crossed down bearish in the bear territory and is suggesting further lows would continue, making the next downside target of 2400 feasible. Clearly, it appears bearish at this point, and a down close of Monday would push the case further for the very unlikely to happen Santa rally.

The JNK weekly chart is slightly less bearish but is still in a Risk OFF mode. It’s bearish.

The Nasdaq weekly chart is bearish with such a candlestick pattern, and MACD crossing into the bear territory. There was a massive failure two weeks ago on the weekly chart and combined with last week’s price action, it looks very bearish indeed.

The small cap Russell2000 ETF weekly chart has already broken down towards the downside target (and support). Bearish!

The DJ Transports also broke down and is heading to downside target of 9000. ThTs a good 5% downside. It failed the 55EMA big time two weeks ago and is way past the support heading for the lower downside target. MACD is bearishly into the bear territory.

Crude oil is slow bearish!

And the Energy Sector is going to break down, out of its huge consolidation zone.

The Financial Sector is leading the downside, towards its own downside target. Similarly failed the 55EMA and MACD is bearish, into bear territory.

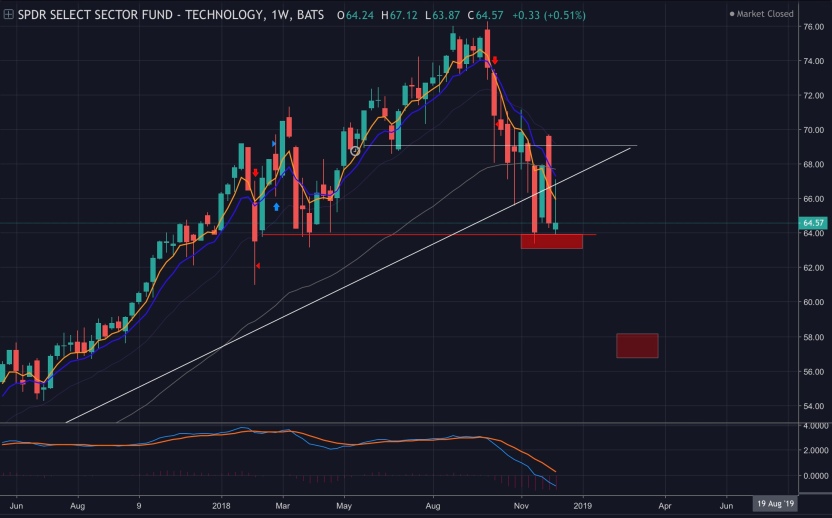
The Technology sector is similar to the Nasdaq. Bearish and looks soon to break down support.
Perhaps the only bright spark… an inverse ETF.
The ProShares UltraShort S&P500, as daily chart depicted below, has a buy signal and is in alignment to go up. Two entry points taken over the past are depicted as large green arrows.

In a quick summary… it really does not look like Santa’s rally is going to happen. In fact, the Grinch appears to have stolen the Christmas rally, and January is already at higher (risk) probability for being down. This is what it looks like currently, to change this outlook, something(s) very largely bullish needs to happen. Currently, really looks like the Grinch did it.
Meanwhile, stay safe and have a great holiday (or for some, a great build up to the holidays)!
If you found this post useful, do leave a comment and share the link! Join in the Telegram group https://t.me/DrWealthHacker
